


Carnival Corporation (CCL) - The Ultimate Turnaround
The company is on a new course, recovering from the pandemic's impact, reducing debt, and improving profitability. Guidance beat, favorable market, and low valuation poise it for significant growth.


Summary:
Carnival Corporation is the world’s largest leisure travel company, operating a fleet of 95 ships with a total passenger capacity of ~270k and a market share of ~37%.
The COVID-19 pandemic severely impacted the company; due to lockdowns, business operations nearly came to a halt, resulting in $25.8bn in losses from 2020 to 2023. Consequently, Carnival's debt increased significantly, rising from $11.5bn in 2019 to $35.9bn in 2022. However, with the revival of the industry and strong operating cash flow, Carnival is now in the process of paying down this debt.
By the end of 2023, the company's Net Debt/EBITDA ratio stood at ~6.8x. However, given the consistent outperformance of their guidance throughout the year—having been raised three times—we expect the ND/EBITDA to decrease to ~4.3x by the end of the year. We project that this ratio will drop below 3.0x by 2027, achieving a more reasonable leverage. Furthermore, credit agencies have raised their ratings in the fall due to outstanding performance.
We expect 2024E earnings per share (EPS) will reach $1.24, a significant improvement from last year’s -$0.06. Additionally, we forecast approximately $1.3bn in free cash flow vs -$0.8bn last year. All major key performance indicators (KPIs) are trending upwards, with 2024 utilization projected at 106% vs 100% in 2023.
The company is implementing several measures to increase its profitability. Most notably, it is adopting a better pricing strategy that emphasizes higher ticket prices and lower onboard costs to enhance customer satisfaction. Additionally, the company is transitioning to larger and more efficient ships.
We believe that the combination of growing profitability, low capital expenditures, and declining debt could position Carnival as a strong cash-generating business in the coming years.
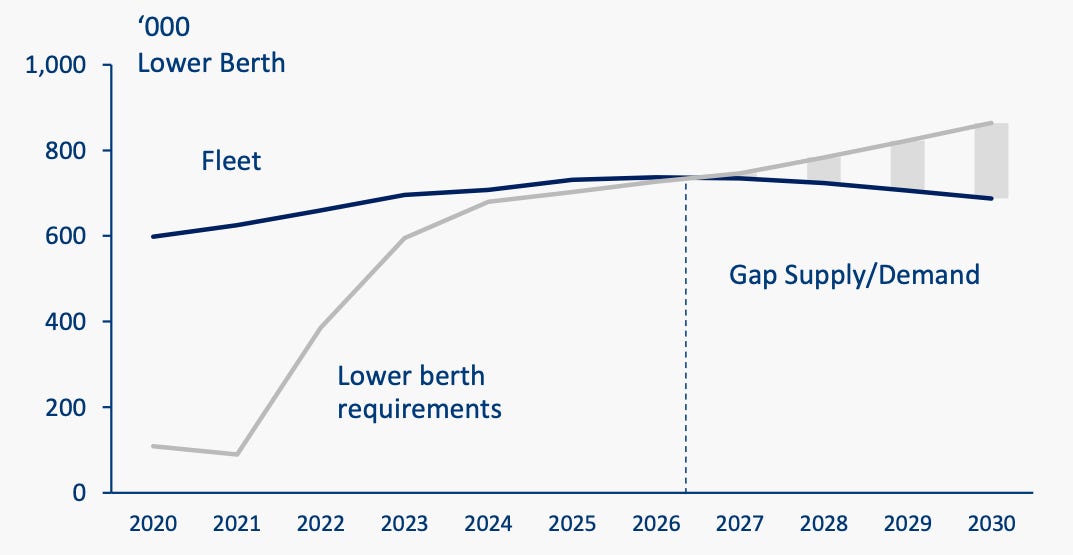
Carnival could benefit from a limited supply of ships. The cruise market has experienced disruptions in ship orders due to the pandemic, which has led to restricted supply growth. As a result, current demand is exceeding pre-COVID levels. Based on existing ship orders, demand is projected to surpass supply by 2026. This situation is expected to lead to increased price growth.
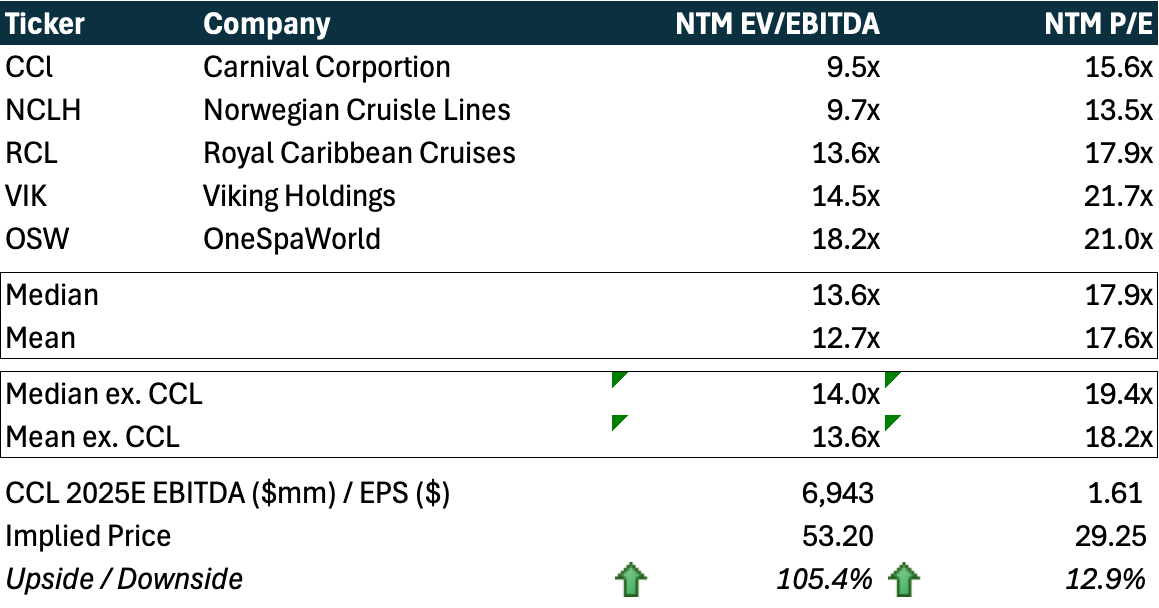
The stock appears to be deeply undervalued. For 2025, we estimate an EV/EBITDA ratio of 8.7x based on our conservative forecasts. When we examine the consensus-based next twelve months (NTM) EV/EBITDA, Carnival Corporation is trading at 9.5x, compared to its peers’ mean of 13.6x, indicating ~105% upside potential.
Our base case Discounted Cash Flow (DCF) valuation suggests a potential upside of ~109%. We consider this conservative, as the overall results are below consensus estimates. We are using current key performance indicators (KPIs) and the guided passenger capacity. After 2027 (beyond the guidance period), we project capacity to grow at 1.5%, which is below the overall market's projected growth rate of ~5.0%. Despite the limited supply favoring price increases, we assume a normal price expansion of 3-4%. Additionally, we expect margins to remain relatively stable, with a 1 percentage point increase in Gross Profit Margin over the next two years.
Download Our Model

Business Overview
Carnival Corporation & plc is the world’s largest leisure travel company, operating a fleet of 95 ships with a total passenger capacity of approximately 270,000. These ships provide a wide range of amenities, including dining, entertainment, spas, casinos, shopping, and more. Carnival operates globally under nine distinct brands:
Carnival Cruise Line (27 ships): The company’s largest brand, offering affordable leisure travel primarily in the North American region.
Princess Cruises (16 ships): Focuses on mid-priced cruise experiences, particularly in Alaska, the Caribbean, and Europe.
Holland America Line (11 ships): Specializes in premium sightseeing cruises throughout Latin America and Europe.
AIDA Cruises (11 ships): The largest cruise line in Germany, concentrating on the European market.
Seabourn (7 ships): Provides ultra-luxury cruises worldwide, featuring exclusive amenities and personalized service.
Costa Cruises (9 ships): Italy's leading cruise line, recognized for its Mediterranean and North Sea voyages.
Cunard (4 ships): Offers luxurious global cruising experiences with an emphasis on “old money” elegance.
P&O Cruises UK (7 ships): The UK’s premier cruise line, targeting destinations in Europe and the Caribbean.
P&O Cruises Australia (3 ships): Australia’s top cruise line, focusing on travel in Oceania.
The company effectively owns ~37% of the overall cruise market. It is followed by RCI’s 23.9% and Norwegian Cruise Line’s 14.1%.
Covid Aftermath
The company was severely affected by the COVID-19 pandemic. Due to lockdowns, business operations nearly came to a complete halt, resulting in a significant decline in revenue, which fell from $20.8bn in 2019 to $5.6bn in 2020 and further down to $1.9bn in 2021. Earnings per share (EPS) also plummeted, dropping from $4.3 in 2019 to -$13.2 in 2020 and -$8.5 in 2021. The combined net loss for years 2020-2022 amounted to staggering $25.8bn.
To cover these losses, the company had to incur substantial debt, which rose dramatically from $11.5bn in 2019 to $34.6bn in 2021 and reached $35.9bn in 2022. However, starting in 2023, the company began to pay it down as it gradually regained stability and generated positive operating cash flow.
Indebtedness ($bn)
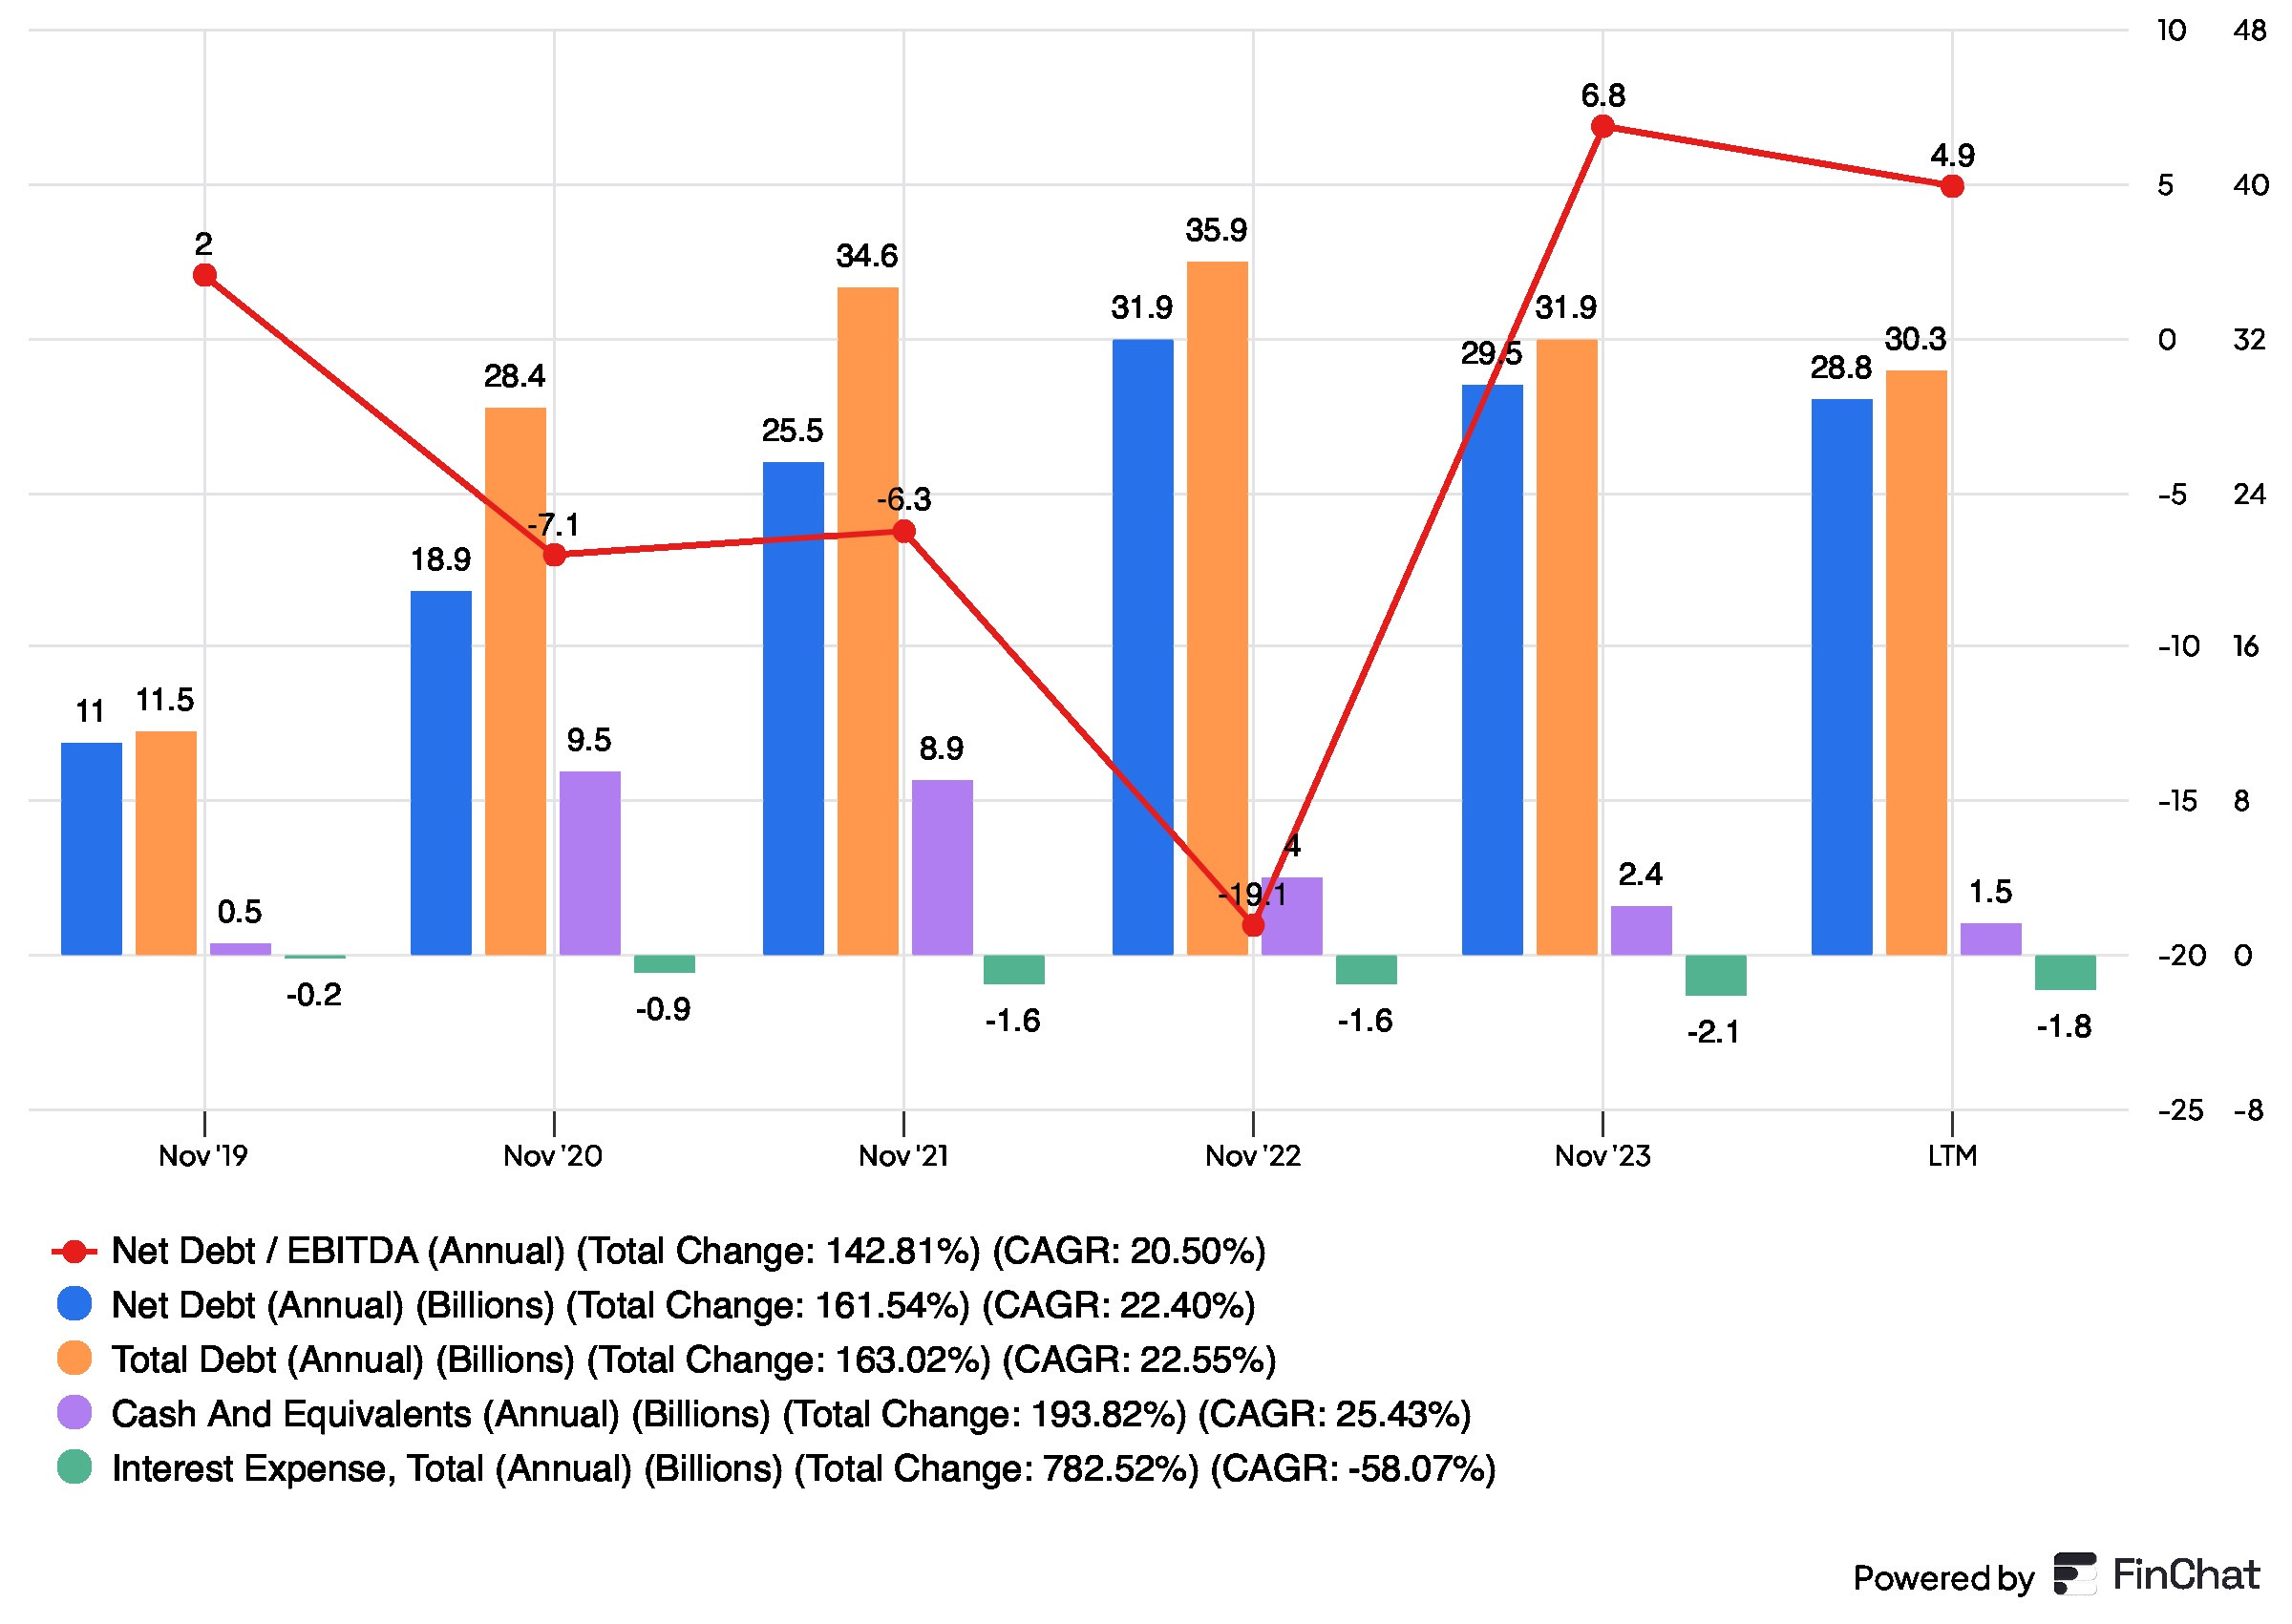
At the end of 2023, the company had a Net Debt/EBITDA ratio of ~6.8x. This is significantly higher than the commonly accepted ceiling of 3.0-3.5x. However, due to the consistent outperformance in guidance throughout the year, this ratio is expected to decrease considerably.
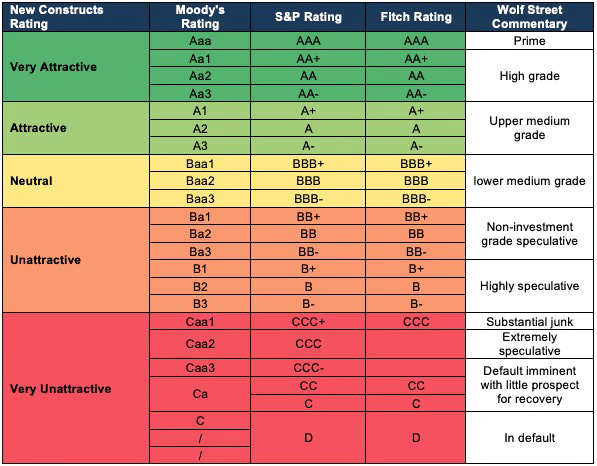
Based on consensus estimates and our forecasts, the Net Debt/EBITDA ratio is projected to drop to ~4.3x by the end of the current year. We think the company should go below 3.0x by 2027, reaching a reasonable leverage. Currently, the company has a BB rating from Fitch and a B1 from Moody’s (upgrades from previously lower ratings). As the situation improves, we expect more upgrades that should reach investment-grade ratings.
Credit Ratings
Business Operations
The company is undergoing a turnaround and is successfully improving its performance, reaching or even surpassing pre-COVID levels. Carnival has a passenger capacity of approximately 270,000, with 9M24 achieving a utilization rate of 106%. This results in an effective passenger capacity of 286,000.
Some may wonder how utilization can exceed 100%. The explanation is straightforward: cruise lines do not include the additional space occupied by children when calculating capacity. For instance, a typical two-person cabin occupied by two parents and a child results in a utilization rate of 150% (3/2).
The company does ~47 cruises per ship, with an average of ~8 days per cruise. These metrics improved extensively compared to previous COVID-impacted years. In 2021 and 2022, Carnival had an avg. cruises per ship of ~8 and ~40, respectively. Average cruise length was at ~43 and ~9 days in 2021 and 2022, respectively.
KPIs

Over the past four years, the average ticket price has increased from $833 in 2021 to an estimated $1,227 in 2024, reflecting a compound annual growth rate (CAGR) of ~14%. In contrast, average spending per ticket has decreased from $757 to $629, with a CAGR of -6%. These trends may indicate shifts in customer behavior; however, we believe there is a more strategic approach at play aimed at enhancing customer satisfaction.
Prior to the pandemic, the company made a strategic decision to use larger ships to improve operational efficiency and increase profitability. This approach takes advantage of economies of scale and network effects, allowing for a more cost-effective and enjoyable cruising experience for passengers. This trend is also among other cruise lines.
The company can enhance its pricing strategy and improve its pricing power by cutting cruise expenses and including more activities in ticket prices. This approach could boost on-the-spot sales, even if customers don’t take full advantage of all the available options. Ultimately, this strategy may lead to a better customer experience and higher profit margins due to improved pricing.
Cruise Market
The company is the largest player in the market, controlling approximately 37% of total revenue. Its main competitors are Royal Caribbean and Norwegian Cruise Lines, which hold about 24% and 14% of the market, respectively. Together, this trio accounts for roughly 75% of total cruise travel and is projected to generate ~$50bn in revenue in 2024, based on Cruise Market Watch numbers.

The cruise industry has experienced significant growth since carrying ~3.7 million passengers in 1990. By 2024, this number peaked at ~30 million, reflecting a compound annual growth rate (CAGR) of ~7%. However, the COVID-19 pandemic had a profound impact, causing passenger numbers to plummet to just ~3.3 million in 2021. The lasting effects of the pandemic are still apparent, particularly in the financial health of businesses like Carnival Corporation, which faced increased debt levels.
Despite this setback, the industry has shown a strong recovery and is projected to achieve ~4% year-over-year growth in 2024, reaching new all-time highs. This recovery indicates a promising outlook for the cruise line industry in the coming years. As the population expands and the number of retirees and middle-aged individuals rises, cruise lines are poised to experience substantial growth in passenger volume over the next few decades.

Fincantieri, a major publicly traded Italian shipbuilding company, expects a cruise passenger growth rate of 5.4% until 2030. The company estimates 39.5mm yearly passengers carried by 2027 (2023-27 CAGR of ~5.7%) and approximately 46.0mm in 2030 (2027-30 CAGR of ~5.0%).

Limited Ship Supply
Fincantieri, in its investor materials, also discussed the expected imbalance between the supply and demand for cruise ships. The shipbuilder noted that the average age of Tier 1 cruise fleets ranges from 11 to 15 years, with many vessels exceeding 15 years. This aging fleet and expected growth in demand creates a need for new ships as the older vessels become less viable. However, the normal flow of orders was disrupted during the pandemic, as cruise lines focused on conserving cash.
Fincantieri anticipates that the gap between supply and demand for leisure ships will become apparent starting in 2026. They have already observed a resurgence of new orders and ongoing negotiations beginning in 2024. Addressing this imbalance could take some time, as smaller to medium-sized ships can be built in 1 to 3 years, while larger vessels may take up to 5 years to complete. Consequently, cruise lines are likely to benefit by rising prices extnesively.
Expected Demand-Supply Balance
Valuation
To value the business, we used Discounted Cash Flow Analysis (DCF) and Comparable Company Analysis (CCA). We think these tools should allow us to estimate the company's intrinsic value.
Main Assumptions
To build our model, we used already discussed key metrics. Passenger capacity for 2024-2026 is based on the company guidance. After 2026, we assume 1.5% passenger capacity growth, substantially below the 5.0% expected by Fincantieri in that period. This assumption implies that Carnival would lose market share. It is possible for a few years but with the 3.5pp spread in all years after 2026 is rather unlikely. Nonetheless, we prefer to make our models more conservative to stress test the overall result.
For 2024 we expect a 106% utilization rate. For the future years, it could grow due to the expected tight market but we conservatively assume 105% going forward. Some carriers like Royal Caribbean had ~109% for the last 9 months of 2024. so we are substantially lower in our forecasts.
We project that each ship will operate 47 cruises per year starting in 2024, with an average cruise length of approximately 8 days. We anticipate that growth rates for ticket prices and onboard spending will slow from 9.0% and 4.5% expected for 2024 to 4% and 3%, respectively, by 2026, and will remain at these levels throughout the forecast period. Although high demand and limited supply of ships may lead to faster overall pricing growth, we prefer to keep our projections more aligned with the long-term inflation rate.
KPIs

Based on our assumptions, we project revenues of ~$25.0bn in 2024 and ~$26.3bn in 2025, compared to a consensus of $25.0bn and $26.1 billion, respectively. This aligns with this year's street forecasts and is slightly above for 2026. After 2026, we expect revenue growth to stabilize at 5.2% per year.
Our earnings per share (EPS) forecast for 2024 is $1.24, and for 2025, it is $1.61. When we compare these figures to the consensus estimates of $1.34 for 2024 and $1.72 for 2025, we see that our forecasts are lower.
We predict that the gross profit margin for this year will be slightly below 53%, expanding to just below 54% by the end of 2026. In the subsequent years, we assume at the same levels.
Cash Flow
Based on the assumptions outlined above, and with capital expenditures (capex) closely aligned with the expected increase in passenger capacity, we have forecasted Free Cash Flows (FCF). We anticipate that FCF will reach ~$1.3bn this year, growing to $2.4bn next year and ~$3.0bn by 2026. The overall FCF margin is projected to increase from 5.3% in 2024 to 12.4% in 2026 before declining to 8.4% starting in 2027.

DCF Results
For the exit multiple, we assumed a 12x EV/EBITDA, which is below the peers' median of ~14x, and the entertainment industry multiple of ~16x, based on Damodaran’s database. However, we believe this multiple better reflects the realities of asset-heavy cruise lines and provides us with an additional margin of safety in our calculations.
We used a 5.9% WACC for discounting cash flows, derived from the 3Q2024 capital structure. Based on these metrics, we calculated the Enterprise Value to be ~$95.8bn. After subtracting ~$27.3bn of net debt (total debt minus cash), and dividing the Equity Value by the number of shares outstanding, we arrived at a target price of $54.08/share. The current share price of $25.90 implies an upside of ~109%.

Comparable Company Analysis
After conducting industry research, we selected four primary peers for Carnival Corporation: Norwegian Cruise Lines, Royal Caribbean Cruises, Viking Holdings, and OneSpaWorld. Carnival's next twelve months (NTM) EV/EBITDA and P/E ratios are 9.5x and 15.6x, respectively. In comparison, the mean values excluding Carnival (CCL) are 13.6x for NTM EV/EBITDA and 18.2x for NTM P/E. This suggests an upside potential of ~105% and ~13%, respectively.
By averaging the price targets derived from the EV/EBITDA and P/E methods, we arrive at a target price of $41.22/share, indicating ~59% upside potential.
Thank you for reading our thesis. Please leave a comment and tell us what are your thoughts on Carnival Corporation!
Disclaimer
The information contained on this website is not and should not be construed as investment advice and does not purport to be and does not express any opinion as to the price at which the securities of any company may trade at any time. The information and opinions provided herein should not be taken as specific advice on the merits of any investment decision. Investors should make their own decisions regarding the prospects of any company discussed herein based on such investors’ own review of publicly available information and should not rely on the information contained herein.
The information contained on this website has been prepared based on publicly available information and proprietary research. The author does not guarantee the accuracy or completeness of the information provided in this document. All statements and expressions herein are the sole opinion of the author and are subject to change without notice.
Any projections, market outlooks or estimates herein are forward looking statements and are based upon certain assumptions and should not be construed to be indicative of the actual events that will occur. Other events that were not taken into account may occur and may significantly affect the returns or performance of the securities discussed herein. Except where otherwise indicated, the information provided herein is based on matters as they exist as of the date of preparation and not as of any future date, and the author undertakes no obligation to correct, update or revise the information in this document or to otherwise provide any additional materials.
The author, the author’s affiliates, and clients of the author’s affiliates may currently have long or short positions in the securities of certain of the companies mentioned herein, or may have such a position in the future (and therefore may profit from fluctuations in the trading price of the securities). to the extent such persons do have such positions, there is no guarantee that such persons will maintain such positions.
Neither the author nor any of its affiliates accepts any liability whatsoever for any direct or consequential loss howsoever arising, directly or indirectly, from any use of the information contained herein. In addition, nothing presented herein shall constitute an offer to sell or the solicitation of any offer to buy any security.
External links, if any, may redirect you to a privately-owned web page or site (“site”) created, operated, and maintained by a third party, which may not be affiliated with Alpha Ark. The views and opinions expressed on the site, other than those presented by Alpha Ark, are solely those of the author of the site and should not be attributed to Alpha Ark. We have not verified the information and opinions found on the site, nor do we make any representations as to its accuracy and completeness as to the third-party information. Further, Alpha Ark does not endorse any of the third-party’s products and services or its privacy and security policies, which may differ from ours. We recommend that you review the third-party’s policies, terms, and conditions to fully understand what information may be collected and maintained as a result of your visit to this website.